THE SHRINKAGE OF A WATER SURFACE:
SAN FRANCISCO BAY
COPYRIGHT © 2001 Paul R. Baumann
INTRODUCTION:
San Francisco Bay, a water body of inspiring beauty and imposing magnitude, covers an area of over 450 square miles (1,165.5 square kilometers) in size. Outlined by softly shaped hills and low mountains it extends for approximately 50 miles (80 kilometers) in its north-south length and from 12 miles (19 kilometers) down to one (1.6 kilometers) mile in its east-west width. It opens to the Pacific Ocean through a spectacular gap called the Golden Gate. The Bay provides a large and refreshing open space for the millions of people who live and work in the crowded urban and suburban landscapes ringing its shores.
Figure 1 provides an overview of the Bay region. This Landsat 7 Enhanced Thematic Mapper Plus (ETM+)digital image was recorded during the late spring period of 1999. It is a true color composite generated by combining ETM+ spectral bands 3 (visible-red), 2 (visible-green), and 1 (visible-blue) as red, green, and blue, respectively. The image covers the San Francisco Bay and Delta region. The cities of San Francisco and Oakland can be seen to the left of center. The bright white areas correspond to urban areas, which surround the Bay. San Pablo and Suisun Bays are to the northwest of center and the Sacramento River is shown in the north/northeast portion of the image. The combination of the three visible bands makes it possible to detect the flow of water and build-up of sedimentation within the Bay. The large green areas in the northeast section of the image are agricultural fields in the Delta region of the Central Valley of California. The bright green colored features at the south end of the Bay are diked salt ponds.
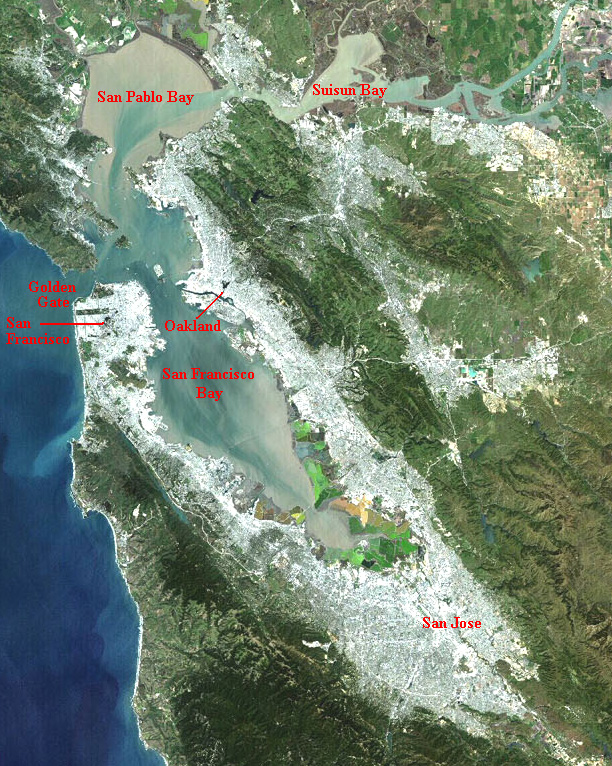
FIGURE 1
This biologically rich and psychologically serene environment is quietly and steadily being modified by the encroachment of various human activities. The Bay is shrinking in size through different sedimentation processes. The goal of this instructional module is to develop a methodology using satellite imagery to identify those water areas within the Bay facing the immediate danger of disappearing and determine the amount of area in immediate danger. This methodology employs a Landsat 7 ETM+ data set (taken July 7, 1999), which covers a study area of 1501 rows by 1501 elements in size. This data set not only includes San Francisco Bay but also the urban development around it.
BACKGROUND:
The Problem: The Shrinkage of the Bay
San Francisco Bay is facing some major environmental problems, foremost among these is the sedimentation, and thereby, the shrinkage of the Bay. In 1850, San Francisco Bay along with San Pablo and Suisun bays covered around 680 square miles (1761 square kilometers). By 1970, 250 square miles (647 square kilometers) of water surface, mainly around the shores, had disappeared. See Figure 2. This rapid reduction in the size of the Bay corresponds to the growth and spread of human activities around the Bay's shoreline, initially as agricultural development and salt pond construction followed by industrialization and urbanization. Diking and filling in with trash and dry fill to create land for port facilities, airports, roads, industrial-commercial developments, and housing areas has been the main justification for reducing the bay's overall size. Diking has also been done to make salt ponds.
FIGURE 2
Figure 3, produced under Project Gigalopolis at the University of California at Santa Barbara, shows the development and spread (in red) of the urban landscape within the Bay area from 1800 to 2100. The years from 1800 to 1990 are based on actual census counts and the years after 1990 relate to population projections. In 1990, the San Francisco-Oakland Metropolitan area had a population of over six million people, making it the fourth largest urban concentration in the United States. In displaying the future population growth around the Bay, Figure 3 is also illustrating the magnitude of the problem of keeping the Bay from shrinking.
FIGURE 3
Of the nearly 430 square miles (1114 square kilometers) left, little over half is less than 12 feet (3.66 meters) deep and can be easily and quickly filled. If filled, the Bay would shrink to 187 square miles (484 square kilometers) and sections would be basically converted into rivers. Unlike the Chesapeake, Delaware, and other bays located along the Atlantic coastline, San Francisco Bay rests completely within the political domain of one state. However, its shores fall within nine counties and thirty-two cities with various vested interests. To complicate further the jurisdiction and control issue, about twenty-two percent of the Bay's bottomland is in private ownership with another twenty-three percent owned by cities and other local governments. Most of this bottomland is situated around the Bay's present shoreline where most future development is likely to occur. California controls about fifty percent of the Bay's bottom and the Federal government only has about five percent. Fortunately, the U.S. Corps of Engineers now has jurisdiction over all tidelands below mean high tide within the Bay. Because of this jurisdiction permits are now required for any diking or filling in, and to obtain a permit public notification and an environmental impact study are required. In addition, the San Francisco Bay Conservation and Development Commission (BCDC) was established to bring together the various interest groups concerned about the use and development of the Bay and to prepare a plan. The BCDC points out that as the result of its efforts the filling process has dropped from 2300 acres (931 ha) per year before 1965 to now 15 acres (6 ha) per year. Also, the San Francisco Bay National Wildlife Refuge was created in the southern part of the bay and most of the salt ponds reside within the refuge. Pond diking can significantly modify tidal zone habitats where salt water and fresh water blend to form biologically rich environments. These various governmental attempts to protect the Bay can have an impact on the large and more publicized endeavors to fill in sections of the Bay.
However, the harder issue relates to how to control the acceleration of sedimentation due mainly to the increased paving of urban and suburban land surfaces which creates more and faster runoff of storm water . Due to growing environmental concerns about storm water runoff, the National Pollutant Discharge Elimination System (NPDES) act was passed. The goal of NPDES is the reduction and elimination of pollutants in storm water discharge from large and medium size municipal storm sewer systems. Large sewer systems serve populations greater than 250,000 and medium size systems deal with populations between 100,000 and 250,000. In the implementation of this act, the United States Environmental Protection Agency published a series of regulations in November 1990 requiring municipalities and industries to obtain NPDES storm water permits. Since no Federal funds were made available to achieve this mandated program, each local government has been faced with finding funds within its own budget, which generally means an increase in local property taxes.
The Physical Environment
The climate of the Bay area can be described best as having warm, dry summers and mild, wet winters. Under the Koeppen climatic classification system the area is defined as a Coastal Mediterranean climate (Csb). September is the warmest month with daily temperatures generally in the 70's. January is the coolest month but winter temperatures rarely reach the freezing level. It is slightly warmer on the east shore of the Bay than the west shore. Total rainfall is about 20 inches during the year, coming predominately in the winter. Figure 4 is a climatic data chart showing the monthly average temperatures and precipitation levels at the Oakland Airport. It illustrates the mild temperatures throughout the year and the summer dry condition. Fog, generally associated with San Francisco, occurs mainly on the Pacific side of the city. The coastal mountains and hills keep most of the daytime fog from reaching within the Bay area.
FIGURE 4
During the summer the climate is associated with stable air coming from a subtropical high-pressure cell located over the Pacific Ocean, near the California coast. Being so close to the land, due to the California cold ocean current, the air from the cell has little opportunity to collect any moisture from water surfaces to provide rainfall. Precipitation amounts, during this period of the year, correspond to semiarid and arid conditions. During the winter when the entire global circulation system migrates southward, the subtropical high-pressure cell situated off of the California coast shifts south. This movement allows the westerlies from the cell to travel over more water before reaching the Bay area, and thereby, bringing in more precipitation. This rain comes mainly in the form of cyclonic precipitation but the hills throughout the Bay area do produce some orographic rainfall. In some years the subtropical high-pressure cell does not shift away from its summer position resulting in a dry winter. After the normal dry summer, a dry winter followed by a second dry summer results in a drought situation. With respect to storm water runoff and sedimentation the winter is a much more active period especially at the beginning of the winter rainy season when impervious urban surfaces are covered with tremendous amounts of grit and hillsides are bare of vegetation from a long, dry summer.
Due to the excellent climate in the Bay area few homes need air conditioning. However, the filling of the Bay can significantly change this situation. The daily tidal flow within the Bay serves as a natural air conditioning system. Decreasing the volume and surface area of water adversely impacts this system. It also increases the probability of more temperature inversions, the prime condition for air pollution and smog. In addition to the tidal flow, the salt ponds maintain the water level, and thereby, the natural air conditioning. The elimination of the ponds to protect wildlife habitats and reduce the filling process will change this situation. This situation might occur anyway due to the economics involved in salt production. Ironically, the excellent climate, one of the principal reasons why so many people have elected to live in the Bay area, might be changed by too many people living there.
In 1830, French scientist Gustave Gaspard de Coriolis identified what is now called the Coriolis force. The Coriolis force deals with the movement of fluids such as water and air on the face of the earth and how they are deflected away from their original direction of movement due to the Earth's rotation. In the Northern Hemisphere, fluids are deflected to the right from their point of origin and in the Southern Hemisphere they are deflected to the left. Most often the Coriolis force is discussed in respect to the flow of air but it also affects the flow of water. The Greeks understood this situation when they built the city of Alexandria in Egypt. They placed the city to the left or on the west side of the Nile so that sediment carried by the Nile into the Mediterranean Sea would not clog the city's port. On leaving the Nile, point of origin, sediment is deflected to the right or to the east of the river. Today, this situation creates problems for the city of Port Said, which is at the Mediterranean entrance to the Suez Canal. The city regularly has to dredge its port of sediment.
At the south end of San Francisco Bay, the Coyote River carries sediment into the Bay in the same manner as the Nile brings sediment into the Mediterranean Sea. Over geological time the east side of the Bay has filled in more than the west side so that today the east side has a large alluvial plain. Other physical processes have also been involved in the creation of this plain. The urbanization and industrialization processes in recent decades have promoted horizontal growth versus vertical growth. For example, commercial activities and industries prefer to have single story buildings, which spread out horizontally over the land rather than having vertical structures several stories tall. These processes generate the need for large areas of flat land. The alluvial plain on the east side of the Bay meets this need. Thus, the industrial center of the Bay is Oakland, not San Francisco. San Francisco and the other cities on the west side of the Bay lack flat land for development. The horizontal expansion of urbanization has resulted in more land being changed into impervious surfaces.
ANALYSIS:
Data Set
On April 15, 1999, Landsat 7 was successfully placed into orbit and its Enhanced Thematic Mapper Plus (ETM+) started recording images. The data set used in this module comes from an ETM+ image recorded on July 7, 1999. It covers San Francisco Bay but not San Pablo and Suisun bays. It is 1501 lines by 1501 elements in size. The software package EarthScenes is used throughout this module and all the functions required to complete tasks associated with this lesson are available in this package.
An ETM+ data set has eight bands. Six of the bands are identical to the Landsat 4 and 5 Thematic Mapper bands. They cover the same spectral range and have the same spatial resolution of 30m by 30m. These spectral bands are 1-5 and 7. The thermal infrared band, Band 6, found on the ETM+ scanner is also available but its spatial resolution has increased from 120m by 120m to 60m by 60m. It covers the same spectral ranges; however, the data have been provided in low and high gain, making for two bands, Band 6L and Band 6H. Finally, there is a panchromatic band, which has a wide spectral range extending from the green visible through the near infrared portion of the spectrum. This band has a spatial resolution of 15m by 15m.
The spatial resolution of the panchromatic band provided with this module has been modified in order to relate to the size of the bands, which is 30m by 30m. To convert all the bands to correspond to the panchromatic band size of 15m x 15m would result in some of the images appearing fuzzy. Also, to cover the geographic area being studied a data set with a 15m by 15m resolution would be four times the size of the present data set and would introduce some problems of displaying reasonable size areas for the lesson. The panchromatic band was reduced down in size by dropping out every other element and every other line. The panchromatic will not be needed for this particular module. Band 6L and Band 6H are not included with the data set provided for this module. They introduced certain technical issues when trying to convert them to the same resolution as the other bands.
Observations
Before attempting to measure the amount of water area that is in danger of being lost, some observations might help in demonstrating how serious the situation is. The visible bands are better for detecting differences within a water body than the near and middle infrared bands, which are good for separating water surfaces from land conditions. Figure 5, a true color composite of bands 1, 2, and 3, shows that urbanization of the east side of the Bay around Oakland and San Leandro extends down to the water's edge. However, in moving southward on this side of the Bay, urbanization appears to have shifted away from the water's edge, and large wetlands and salt ponds exist between the Bay and the urban development. Most of this area is under pressure to be developed because of the need for flat land and economic development. Figure 6 is a false color composite (Bands 4,3 and 2), which shows the west side of the Bay directly across from the wetlands and salt ponds on the east side of the Bay. The west side of the Bay faces even greater pressure for flat land because so little of such land exists initially. An examination of Figure 6 shows how urbanization is moving southward taking over the wetlands and salt ponds. Thus, a true concern exists for the potential shrinkage of the Bay.
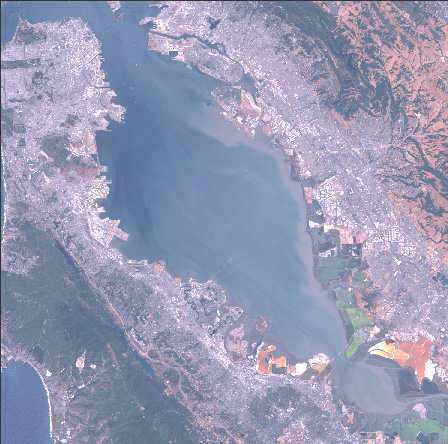
FIGURE 5
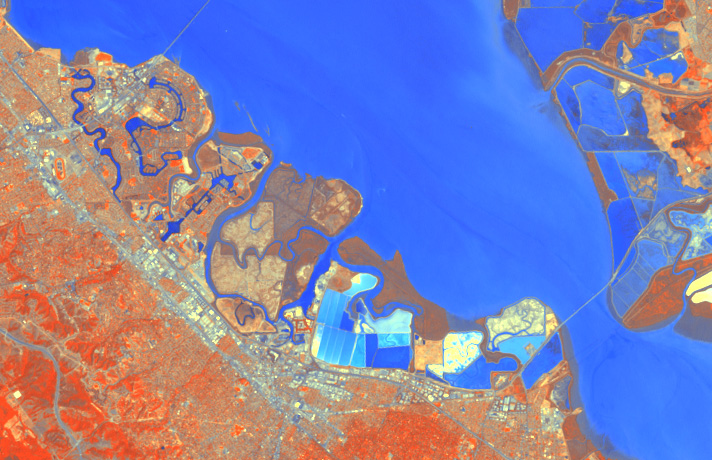
FIGURE 6
Once the wetlands and salt ponds are developed, the next step is to extend further out into the Bay. By the removal of the wetlands and the straightening out of streams, sediment from the surrounding hills and grit from impervious urban surfaces wash into the Bay. Figure 7 is a false color composite (Bands 4,3 and 2)superimposed on a navigational chart of the area around the city of San Lorenzo. Note on the color composite that a delta shaped area extends into the Bay. This is deposition of sediment and grit being carried by the San Lorenzo Creek into the Bay. Note on the chart that this deposition is described as being "foul." There are two other items to be noted on the chart. The spatial pattern of the sediment and grit flowing into the Bay does not correspond to the pattern appearing on the satellite image. The chart, like any map, is an attempt to generalize conditions based on limited information. The image most likely provides a more accurate picture. The second item is the numbers in the Bay. These are depth figures given in feet. The Bay is only 1 to 2 feet deep in this area. It would not take too much effort to fill in this area.
Figure 8 covers an area immediately north of the area shown in Figure 7. A boat moving in a straight line from a marina can be observed in this composite. This boat and its wake cannot be detected in the regular images or other color composites. This color composite is the result of stretching the three visible bands twice. The navigational chart shows why this boat is moving along in a straight line. A path in the Bay floor has been opened, which allows boats from the marina to reach deeper water. Another reason why this path exists can be seen on the chart. It contains the sewer line for Mulford Gardens and San Leandro. Thus, people with yachts have to follow a sewer line to reach open water. Note the area immediately east and southeast of the marina and compare it to the same area on the Figure 7 color composite. The bright red areas on Figure 7 form a golf course associated with the marina. It is hard to detect the golf course on the Figure 8 color composite. The chart shows part of the golf course as being built on the "foul" area. This difference is due to the chart being produced in 1986 and the satellite image being taken in 1999. However, this difference also illustrates how quickly a "foul" land area was converted into a land use to fulfill certain human interests.
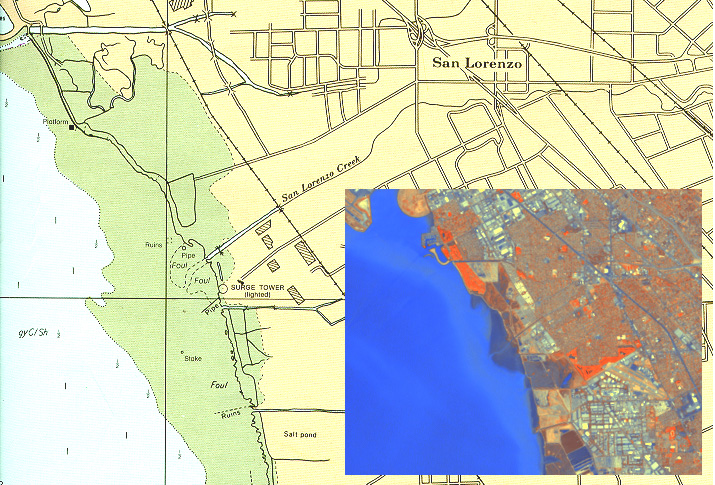
FIGURE 7
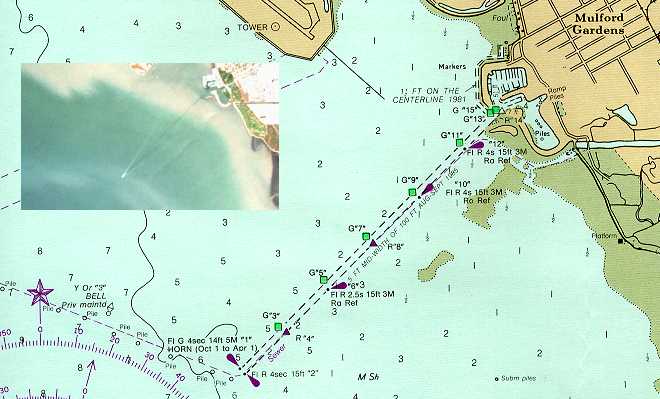
FIGURE 8
Endangered Areas
The initial step in addressing the problem of identifying endangered areas within the Bay is to select the best spectral band to use for the analysis. As indicated previously the three visible bands show variations within water, which make them the best candidates for the task. The near and middle infrared bands do not provide much differentiation within water but they do an excellent job of separating water from land. The thermal infrared bands do not have the spatial detail required. The panchromatic band is another possible candidate but its wide spectral range includes the near infrared portion of the spectrum, which makes it a weaker candidate.
Each of three visible bands displays spectral variations within the Bay. Since these bands are conveying reflective energy, it is important to determine if they are showing surface conditions on the water or water depth. The deeper the water, the harder it becomes to identify depth. A deep channel is maintained at the south end of the Bay as indicated on the chart portion of Figure 9. This channel is around 40 feet deep, which makes it difficult for the visible bands to identify it. However, the channel can be seen on all three bands, which have been superimposed on the chart in Figure 9. This indicates that any one of the bands can be used to identify more shallow water areas. A closer examination of the three bands reveals another important item. The reflective nature of the salt ponds and wetlands in Band 2 and Band 3 is very similar to the reflective conditions within the Bay, which might create problems separating these areas from water within the Bay. Band 1 has similar problems but not to the degree found in the other two bands. Thus, Band 1 will be used throughout the remainder of this lesson.
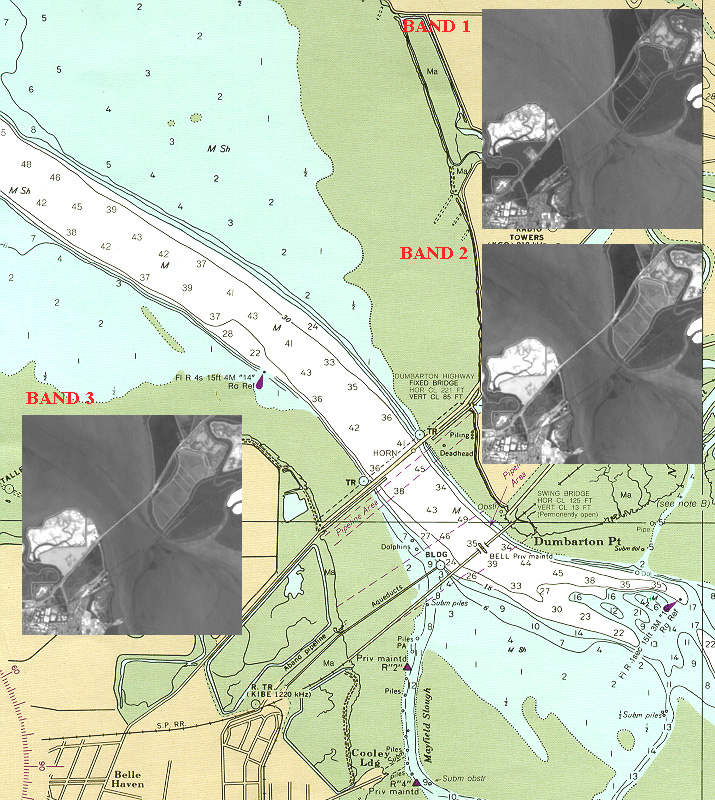
FIGURE 9
Band 1 was stretched between 63 and 190 to make better use of most of its data. See Figure 10. Its original dynamic range was 63 to 250 but only .005 of its data values fell between 190 and 250. One of the difficulties in using Band 1 or any of the visible bands is that many of the reflectance values associated with water surfaces are also found with land surfaces. It would be impossible to pick out the endangered water areas without also having a large amount of various land surfaces being selected. Thus, it becomes necessary to negate or reduce land surface conditions.
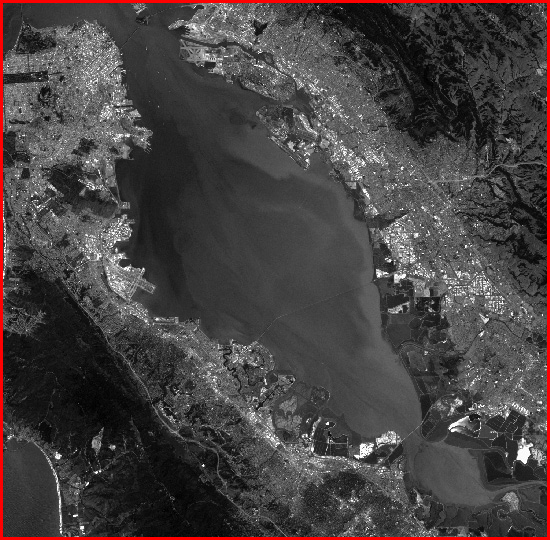
FIGURE 10
Band 4 is the best spectral band to separate the land from the water. Band 4 was first stretched between 14 and 197. Next, the Pixel Read-Out function was used to determine the water value range and the land value range, which were 1-52 and 53-250, respectively. Using this information a density slice classification of Band 4 was created with two classes, water and land. This classification was saved as a new layer in the EarthScenes master image file. The data values in this layer were "1s" and "2s" for water and land. This layer was stretched and saved as a new layer. In the new layer all water surfaces had a value of 1 and all land surfaces a value of 250. This layer and the stretched Band 1 layer were added to produce another layer. In adding the two layers together all values above 250 were designated to be truncated. Since all the land values in the one layer were already 250, the addition of these values to the corresponding pixels in Band 1 resulted in all the land pixels being above 250, and therefore, assigned the value of 250. In the case of the water pixels, only the value of 1 was being added to them and they would not exceed 250 and be truncated. Figure 11 shows the new layer for Band 1 with land surfaces appearing all in white and not conflicting with water, with respect to reflectance values.
FIGURE 11
It might be desirable to create and view the histogram for this new layer. See Figure 12. The water values barely appear on the histogram since all the land values have been assigned the value of 250 and that bar on the histogram dominates. A review of this histogram shows that the water values range between 11 and 102. With this information, the new layer was stretched to produce yet another layer. The values used in the stretching process were 1 and 105. Since there were no water values above 102, placing the upper limit slightly above 102 kept the higher reflectance water pixels from merging with the land values.
FIGURE 12
Figure 13 shows the histogram for the new layer. The distribution across the histogram of the water pixel values is more spread out and easier to see in comparison to Figure 12. Figure 14 displays the new layer. This layer shows a much greater variation within the water surfaces but at the same time no variation in the land surfaces occurred. This is the layer from which the final classification and measurements will be obtained.
FIGURE 13
FIGURE 14
The goal of the module is to identify the endangered areas within the Bay and determine the amount of area in immediate danger of disappearing. Those areas with one-half foot or less of water coverage should be viewed as areas that are already more land than water. These areas are basically those sections along the edge of the Bay that have been designated as being "foul" or "muck" areas. As mentioned above, the navigational charts and the satellite image do not exactly agree on the coverage and location of these areas. The satellite image might be providing a more accurate presentation of these areas. For the purpose of this module, the areas between one-half to two feet of water coverage are the areas in immediate danger of disappearing and resulting in further shrinkage of the Bay.
The navigational charts are too large to present in a digital format for this lesson. Thus, using key sections of the charts and the Pixel Read-Out function, it was determined that the spectral values ranging between 186 and 249 corresponded reasonably close to the one-half to two foot water coverage area. When these values were compared to the histogram, Figure 13, it was interesting to note the obvious break point in the histogram at 186. A density slice classification was done on the histogram producing three classes. See Figure 15. The classes were: Other Water and Wet Surfaces (1-185), Endangered Water Areas (186-249), and Land Surfaces (250). Figure 16 is the three-class map created from this classification.
FIGURE 15
FIGURE 16
The red colored areas are the endangered sections of the Bay. They are mainly on the east side of the Bay where sediment and grit from the hills and urban areas are dumped into the Bay. Winter rain, mainly in the form of cyclonic precipitation, comes across the Bay moving eastward. The west side of the hills around the Bay produce orographic rainfall; whereas, the east side of the hills fall into rain shadow areas. The hills on the east side of the Bay face westward and receive the rain, which in turn washes sediment and grit into the east side of the Bay. The hills on the west side of the Bay are in the rain shadow areas and do not receive as much rain resulting in less runoff. The rain around these hills occurs on the Pacific Ocean side and runoff flows more into the ocean. In addition, the impact of the Coriolis force, which was previously discussed, must be considered. Thus, it is not surprising to find the greatest concentration of the endangered areas on the east side of the Bay.
One pattern of interest is the red colored area farther out in the Bay directly in line with San Lorenzo Creek and its "foul" delta. Is sediment and grit from this stream flowing farther out into the Bay? Another pattern of interest is that the "foul" and "muck" areas were classified as water surfaces. In Band 1, these areas have a low (dark) reflectance level similar to deep areas within the Bay.
In general, the classification produced very good results. Some misclassifications occurred in the salt ponds and on the San Mateo-Hayward bridge crossing over the Bay. These errors are minor and the classification is well within the 85 percent accuracy range accepted for land (water) cover maps. In addition to the map, pixel counts were provided for the three classes. These counts are provided in the below table.
| Surface |
Pixels* |
Acres | Hectares | Sq. Mi. | KM2 |
| Other Water and Wet Surfaces | 621,545 | 138,157.6 | 55,912.4 | 215.87 | 559.12 |
| Endangered Water Areas | 71,024 | 15,787.3 | 6,389.1 | 24.66 | 63.89 |
| Land Surfaces | 1,560,432 | 346,854.3 | 140,371.9 | 541.96 | 1,403.72 |
With these figures and knowing that each pixel is 30m x 30m in area, various areal counts can be calculated. In other words, the endangered water areas within the Bay cover 15,787.3 acres (6,389.1 ha) or 24.66 square miles (63.89 square kilometers).
FINAL COMMENTS:
One must keep in mind that this instructional module only covers a portion of the entire Bay region. It does take into account San Pablo Bay and Suisun Bay, which based on Figure 1 appear to have a greater proportion of endangered water conditions than San Francisco Bay. Below are the three key navigational charts used in this module. Also, below are some web sites dealing with the topic of the Bay and its endangered environment.
CHARTS:
WEB SITES:
Access USGS - water flow, wetlands, water quality, hazards and more, from the US Geological Survey
The Bay Institute of San Francisco - dedicated to the protection and restoration of the ecosystems of San Francisco Bay, the Sacramento - San Joaquin delta, and the rivers, streams and watersheds tributary to the estuary.
BayKeeper - working to reduce pollution in San Francisco Bay, in order to restore its health and productivity.
California Water Clearinghouse - providing a newsletter and discussion group on Bay-Delta issues.
San Francisco Bay Conservation and Development Commission was established to prevent the unnecessary filling of San Francisco Bay and increase pubic access to and along the Bay shoreline.
http://ice.ucdavis.edu/guide_to_california_programs_for_biodiversity_conservation/bcdc/bcdc.htm
San Francisco Bay Model Visitor Center - unique scientific tool for exploring water movement patterns in the San Francisco Bay-Delta Estuary.
San Francisco Bay Water Quality Control Board
San Francisco Bay Wildlife Refuge - exists to preserve wildlife habitat, protect threatened and endangered species, protect migratory birds, and provide opportunities for nature study.
San Francisco Estuary Institute - mission: to provide the scientific understanding necessary to manage the complex and biologically rich San Francisco Estuary.
San Francisco Estuary Project
Save San Francisco Bay Association
USGS San Francisco Bay Program: Lessons Learned